
Reports, notifications and event delivery to SIEM
The appliance does not try to replace your security operations centre. It delivers events where they are already collected, and writes directly to whoever is on duty today.
- default syslog port
- 514default syslog port
- report formats
- 3report formats
- minimum notification interval
- 5 minminimum notification interval
How it works
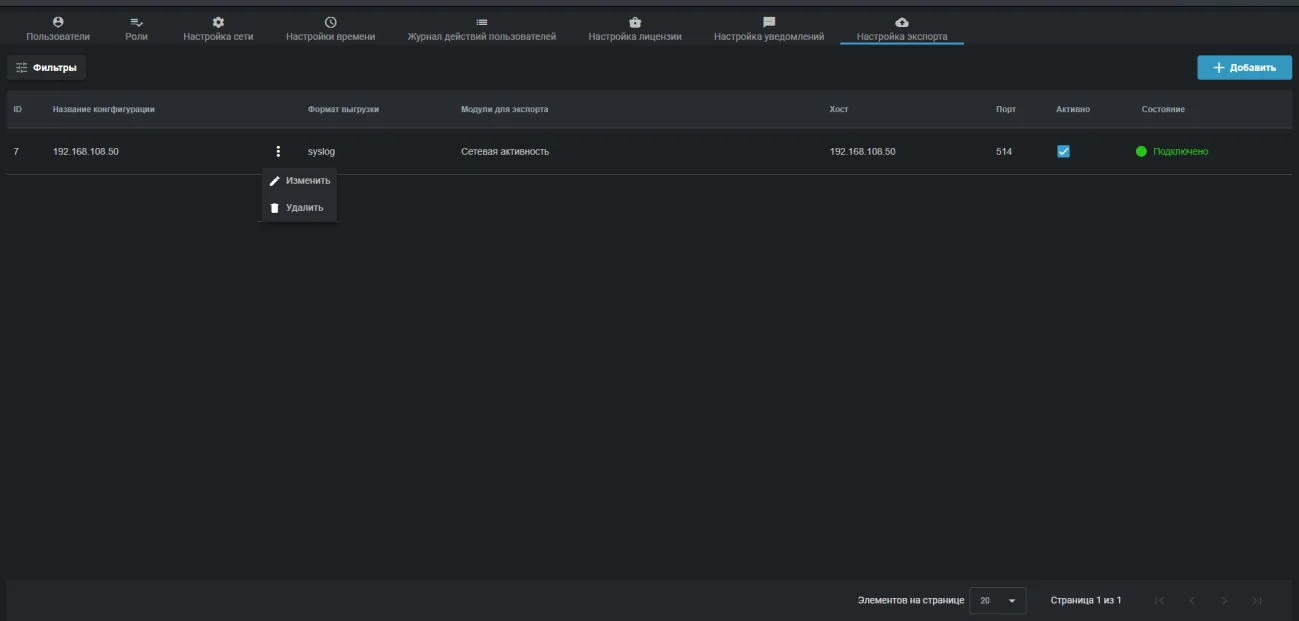
To deliver events to a collection system you create an export configuration: syslog or JSON format, a list of modules, and the address and port of the receiver. The connection state is visible right in the table, so a broken channel does not go unnoticed.
Operation with Wazuh is documented and verified in practice. For MaxPatrol SIEM the collection is configured on the SIEM side through its own collector, which pulls data from the appliance over HTTP in JSON format.
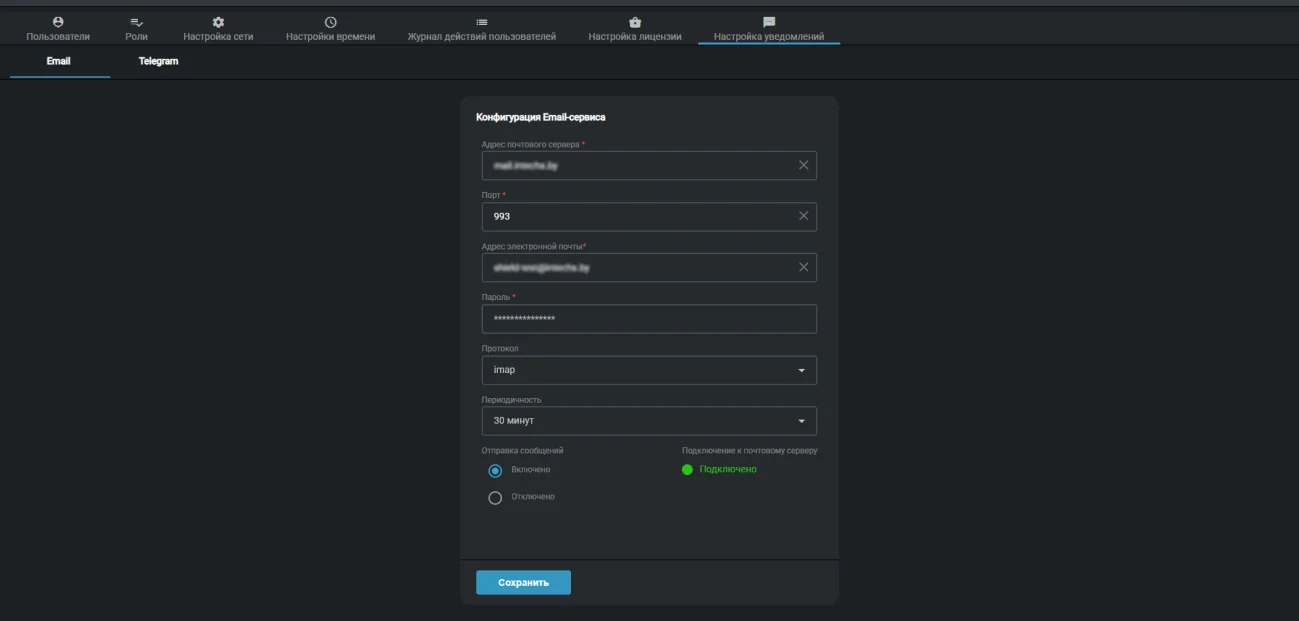
Direct delivery works in parallel. The appliance sends notifications to email and to a Telegram chat, and it is configured not as all or nothing but per specific event type of every module: critical network activity alerts, new hosts, high severity Wi-Fi threats and so on.
What goes where
- syslog to a collector, port 514 by default
- JSON to a collector, verified with Wazuh
- Collection by MaxPatrol SIEM over HTTP
- Email over SMTP, SMTP TLS or IMAP
- Messages to a Telegram chat through a bot
- HTML for quick review and forwarding
- XLSX for analysis and pivot tables
- JSON for loading into other systems
- PCAP for handing raw traffic to an engineer
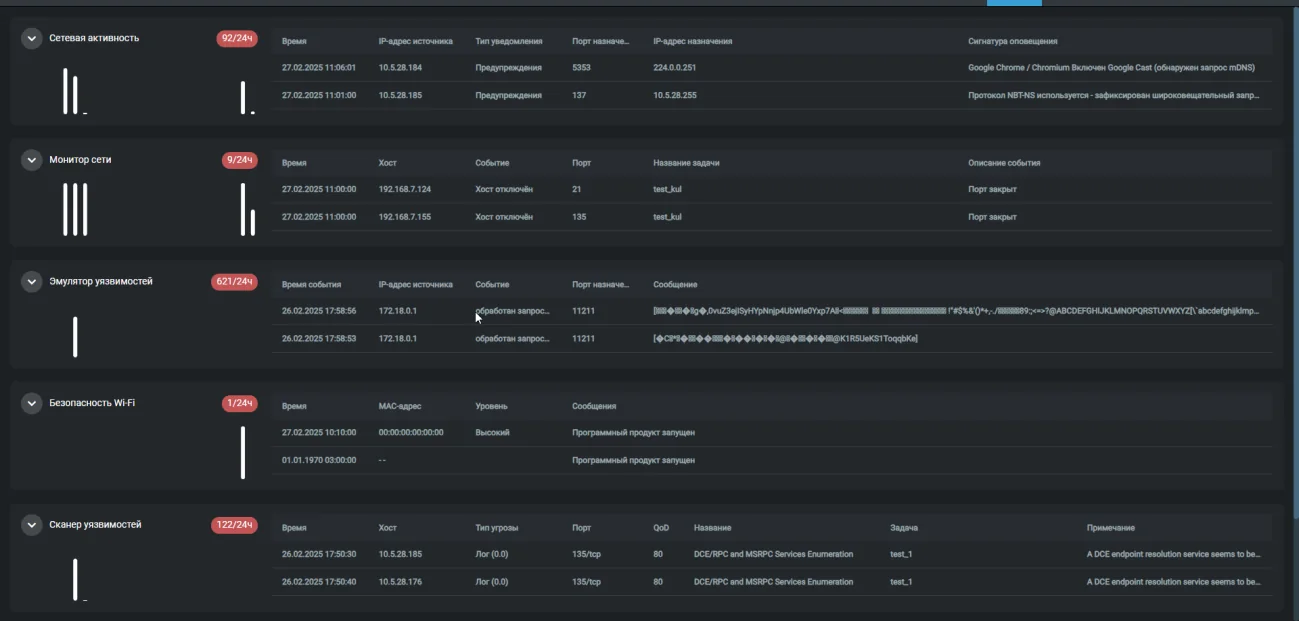
Per module notification settings
Network activity
Critical events, warnings, notices and other are enabled separately. Usually only critical ones go to the duty officer.
Network monitor
New host found, port change, connection to a host lost.
Wi-Fi and vulnerability scanner
Separately by level: high, medium, low. The vulnerability scanner adds informational records.
Infrastructure integrity and honeypot
Errors, warnings and notices of integrity control, events from both decoys.
All capabilities of the appliance
Capabilities of the appliance- Traffic monitoringThe appliance inspects a copy of your traffic, matches it against a signature database and raises an alarm when something happens that should not.Learn more
- Vulnerability scannerThe appliance looks for what someone could walk in through: outdated versions, weak algorithms, forgotten services and systems that reached end of life.Learn more
- Network inventoryThe appliance regularly recounts what lives in your network and reports when the picture changes: a new host appeared, a new port opened, a device went missing.Learn more
- Intruder honeypotThe appliance deploys a decoy in your network. A legitimate employee has no reason to touch it, so any request is a signal: somebody is already inside and looking around.Learn more
- Wi-Fi securityYou can build a perfect wired perimeter and still have somebody's personal router standing next to the finance department. The appliance listens to the air and shows what is going on.Learn more
- File integrityA modified router config or a replaced executable on a server generates no suspicious traffic. They are found by comparison against a baseline.Learn more
We will prepare a quote for your network
Tell us about your infrastructure: how many sites, which switch sits in the core, whether you already run a SIEM. We will pick the edition and the connection scheme, and calculate the cost.
- We reply within one business day
- We design the connection scheme for your topology
- We show the interface on a live demo unit