
Network traffic monitoring and intrusion detection
The appliance inspects a copy of your traffic, matches it against a signature database and raises an alarm when something happens that should not.
- categories of security events
- 43categories of security events
- alert severity levels
- 4alert severity levels
- raw traffic export
- PCAPraw traffic export
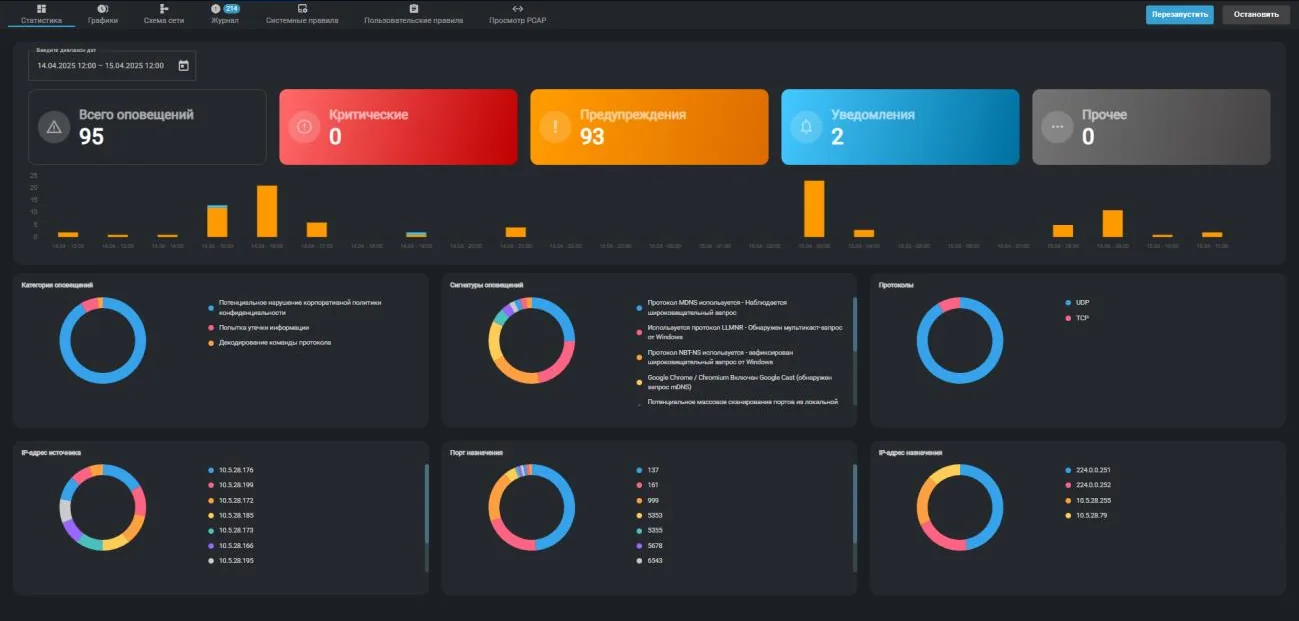
How it works
The module starts together with the appliance software and runs continuously. It captures traffic from the mirror port and compares it against a set of signature rules. When traffic matches a rule, an alert with a category and a severity level appears in the log.
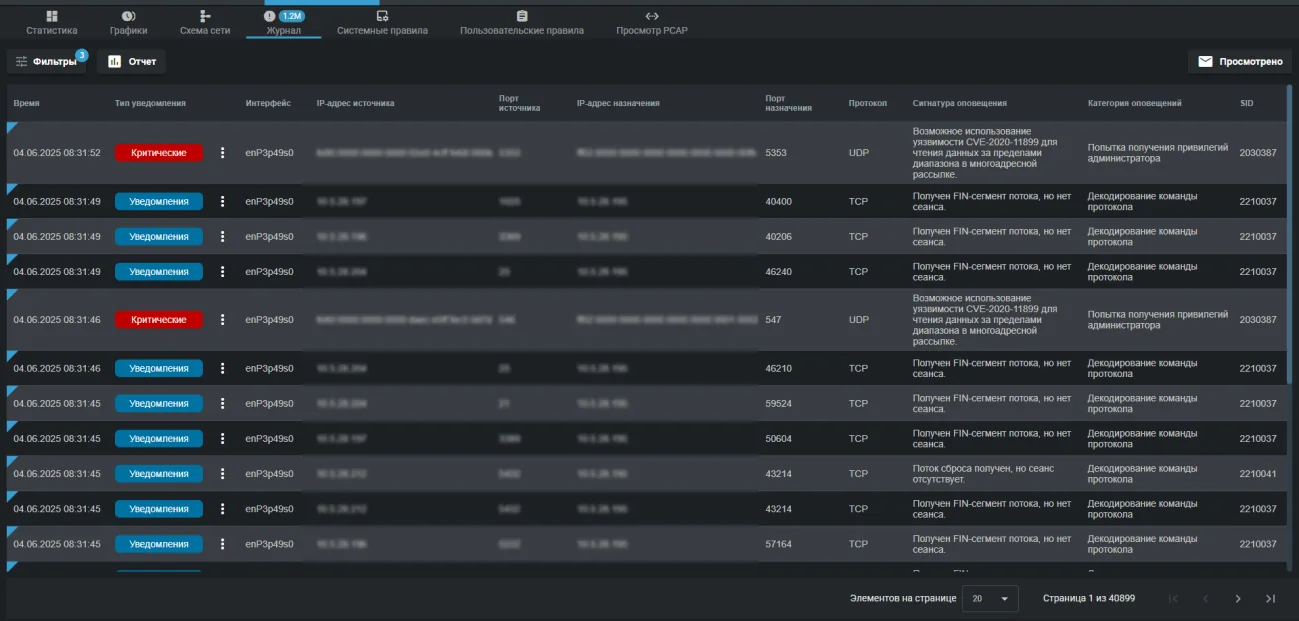
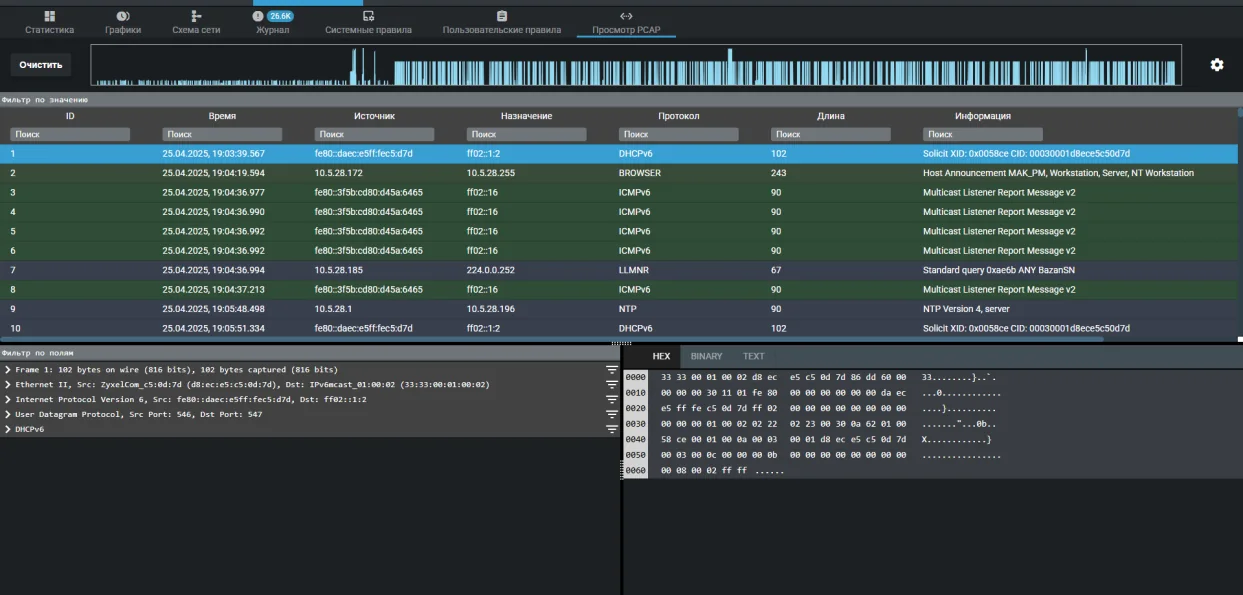
From there you can work with that alert: open the event details and the text of the rule that fired, download the related slice of traffic as a pcap file or open it right away in the built in viewer. The engineer never has to switch tools.
A network map is built separately: nodes are addresses, links are flows between them. It answers a question that usually goes unanswered in a large network: who actually talks to whom, and at what volume.
What the appliance treats as a security event
Categories come from the rule base and fall into four severity levels. Below are the real names from the interface.
- Network trojan detected
- Malware command and control activity detected
- Command and control domain detected
- Exploit kit activity detected
- Attack on a web application
- Attempted and successful administrator privilege gain
- Successful credential theft detected
- Executable code detected
- Targeted malicious activity detected
- Denial of service attack detected
- Large scale information leak
- Cryptocurrency mining activity detected
- Login attempt with a default username and password
- Device receiving an external IP address detected
- Potentially unwanted program detected
- Possible social engineering attempt
- Access to a potentially vulnerable web application
- Client used an unusual port
- Network scanning detected
- Suspicious string detected
- Protocol command decoding
- General ICMP event
- Unknown traffic
What you can configure
Custom detection rules
Any system rule can be copied into your own set and rewritten for your infrastructure: action, protocol, addresses and ports of both sides, direction, category, signature text and tags. Custom rule numbers are taken from the range 1,000,000 to 2,000,000.
Enabling and disabling system rules
A rule that only creates noise in your network can be switched off straight from the log or from the system rules list, without restarting the whole appliance.
Filters and reports
The log filters by time, interface, addresses and ports, protocol, category and signature. The filtered result exports to HTML, JSON or XLSX with aggregation by a chosen field.
All capabilities of the appliance
Capabilities of the appliance- Vulnerability scannerThe appliance looks for what someone could walk in through: outdated versions, weak algorithms, forgotten services and systems that reached end of life.Learn more
- Network inventoryThe appliance regularly recounts what lives in your network and reports when the picture changes: a new host appeared, a new port opened, a device went missing.Learn more
- Intruder honeypotThe appliance deploys a decoy in your network. A legitimate employee has no reason to touch it, so any request is a signal: somebody is already inside and looking around.Learn more
- Wi-Fi securityYou can build a perfect wired perimeter and still have somebody's personal router standing next to the finance department. The appliance listens to the air and shows what is going on.Learn more
- File integrityA modified router config or a replaced executable on a server generates no suspicious traffic. They are found by comparison against a baseline.Learn more
- Reports and SIEMThe appliance does not try to replace your security operations centre. It delivers events where they are already collected, and writes directly to whoever is on duty today.Learn more
We will prepare a quote for your network
Tell us about your infrastructure: how many sites, which switch sits in the core, whether you already run a SIEM. We will pick the edition and the connection scheme, and calculate the cost.
- We reply within one business day
- We design the connection scheme for your topology
- We show the interface on a live demo unit